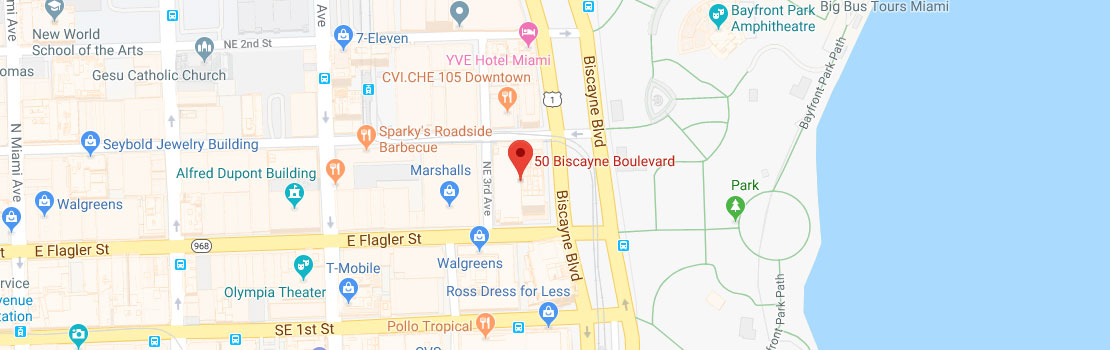
Experience sweeping panoramic views of Biscayne Bay and the Miami skyline from this exceptional high-floor residence, ideally situated in the heart of Downtown. This bright and spacious 1,357SF 2-bedroom + den home is filled with natural light and features a desirable open-concept layout, perfect for both relaxing and entertaining. The contemporary kitchen is outfitted with premium stainless-steel appliances, granite countertops, and abundant cabinetry. Floor-to-ceiling windows enhance the space, while capturing stunning sunrises and vibrant city views. The primary suite serves as a private retreat, offering generous closet space and a well-appointed bathroom with dual vanities, a soaking tub, and a separate glass-enclosed shower. The secondary bedroom functions as a junior suite, comfortably accommodating a king-size bed and featuring a walk-in closet. Residents of 50 Biscayne enjoy an array of resort-style amenities, including a state-of-the-art fitness center, spa, infinity-edge pool, 24-hour concierge, and valet service. Just steps from Bayfront Park, and surrounded by top-tier dining, shopping, and entertainment, this residence delivers the ultimate Miami lifestyle with unmatched convenience.
| Address | Unit # | Price | %Chng | Bed/Bath | Square Feet | Square m2 | Maint/$ |
|---|---|---|---|---|---|---|---|
| 111 E Flagler St #810 | 810 | $229,000 | 1/1 | 774 | 72 | $850 | |
| 111 E Flagler St #606 | 606 | $230,000 | 1/1 | 553 | 51 | $644 | |
| 111 E Flagler St #507 | 507 | $232,000 | 1/1 | 623 | 58 | $686 | |
| 111 E Flagler St #506 | 506 | $235,000 | 1/1 | 553 | 51 | $648 | |
| 111 E Flagler St #1003 | 1003 | $255,000 | 1/1 | 594 | 55 | $655 | |
| 111 E Flagler St #410 | 410 | $262,000 | 1/1 | 774 | 72 | $0 | |
| 234 NE 3rd St #1106 | 1106 | $269,000 | 1/1 | 738 | 69 | $874 | |
| 111 E Flagler St #708 | 708 | $275,000 | 1/1 | 615 | 57 | $723 | |
| 234 NE 3rd St #UPH09 | UPH09 | $282,000 | 1/1 | 625 | 58 | $738 | |
| 234 NE 3rd St #909 | 909 | $289,000 | 1/1 | 625 | 58 | $737 | |
| 111 E Flagler St #705 | 705 | $299,000 | 2/1 | 836 | 78 | $975 | |
| 133 NE 2nd Ave #209 | 209 | $307,000 | 1/1 | 770 | 72 | $765 | |
| 111 E Flagler St #805 | 805 | $309,000 | 2/1 | 836 | 78 | $973 | |
| 133 NE 2nd Ave #1103 | 1103 | $310,000 | 1/1 | 632 | 59 | $532 | |
| 234 NE 3rd St #905 | 905 | $319,000 | 1/1 | 685 | 64 | $640 |
| Unit # | Closed Date | Sold Price | List Price | Bed | Bath | Living Area | Days on Market |
|---|---|---|---|---|---|---|---|
| 324 | 05/22/2026 | $222,500 | $249,500 | 0 | 1 | 506 | 5 months |
| 4616 | 04/15/2026 | $415,000 | $439,900 | 0 | 1 | 362 | 4 months |
| 348 | 04/02/2026 | $250,000 | $250,000 | 0 | 1 | 501 | 4 months |
| 318 | 02/20/2026 | $230,000 | $250,000 | 0 | 1 | 506 | 2 months |
| 1906 | 01/28/2026 | $475,000 | $489,900 | 0 | 1 | 443 | 3 months |
| Number of Units | Avg Price | Avg $/SQFT | Lowest Sale Price | Highest Sale Price | Avg Days on Market |
|---|---|---|---|---|---|
| 5 | $318,500 | $761 | $222,500 | $475,000 | 126 |
| Unit # | Closed Date | Sold Price | List Price | Bed | Bath | Living Area | Days on Market |
|---|---|---|---|---|---|---|---|
| 1905 | 04/20/2026 | $420,000 | $450,000 | 1 | 1 | 442 | 3 months |
| 4309 | 03/30/2026 | $470,000 | $495,000 | 1 | 1 | 588 | 1 month |
| 1208 | 03/09/2026 | $345,000 | $355,000 | 1 | 1 | 740 | 2 months |
| 803 | 02/13/2026 | $227,000 | $228,000 | 1 | 1 | 594 | 2 months |
| 229 | 02/11/2026 | $415,000 | $450,000 | 1 | 1 | 1,000 | 2 months |
| 3807 | 02/02/2026 | $390,000 | $399,000 | 1 | 1 | 768 | 1 week |
| L-414 | 01/30/2026 | $570,000 | $580,000 | 1 | 1 | 891 | 2 months |
| Number of Units | Avg Price | Avg $/SQFT | Lowest Sale Price | Highest Sale Price | Avg Days on Market |
|---|---|---|---|---|---|
| 7 | $405,286 | $621 | $227,000 | $570,000 | 69 |
| Unit # | Closed Date | Sold Price | List Price | Bed | Bath | Living Area | Days on Market |
|---|---|---|---|---|---|---|---|
| 1602 | 05/27/2026 | $526,100 | $580,000 | 2 | 2 | 1,129 | 3 months |
| 1803 | 04/29/2026 | $535,000 | $590,000 | 2 | 2 | 1,058 | 5 months |
| 3709 | 04/27/2026 | $1,150,000 | $1,200,000 | 2 | 2 | 983 | 4 months |
| 4704 | 03/10/2026 | $650,000 | $680,000 | 2 | 2 | 1,121 | 2 months |
| 312 | 03/04/2026 | $385,000 | $440,000 | 2 | 2 | 1,120 | 7 months |
| 1808 | 02/19/2026 | $405,000 | $450,000 | 2 | 2 | 1,006 | 6 months |
| 3503 | 01/30/2026 | $690,000 | $715,000 | 2 | 2 | 1,235 | 2 months |
| Number of Units | Avg Price | Avg $/SQFT | Lowest Sale Price | Highest Sale Price | Avg Days on Market |
|---|---|---|---|---|---|
| 7 | $620,157 | $617 | $385,000 | $1,150,000 | 140 |
| Unit # | Closed Date | Sold Price | List Price | Bed | Bath | Living Area | Days on Market |
|---|---|---|---|---|---|---|---|
| 3102 | 02/27/2026 | $1,030,000 | $1,099,000 | 3 | 2 | 1,789 | 3 weeks |
| Number of Units | Avg Price | Avg $/SQFT | Lowest Sale Price | Highest Sale Price | Avg Days on Market |
|---|---|---|---|---|---|
| 1 | $1,030,000 | $614 | $1,030,000 | $1,030,000 | 23 |
www.fiftybiscayne.com is not responsible for the accuracy of the information listed above. The data relating to real estate for sale on this web site comes in part from the Internet Data Exchange Program and the South East Florida Regional MLS and is provided here for consumers personal, non-commercial use, It may not be used for any purpose other than to identify prospective properties consumers may be interested in purchasing. Real Estate listings held by brokerage firms other than the office owning this web site are marked with the IDX logo. Data provided is deemed reliable but not guaranteed. Listing provided by Douglas Elliman
© Copyright 2012-2016. Brenda Bassett | Broker-Associate | 50 Biscayne Blvd | Downtown Miami, FL 33131 | Cell: 305-707-4007
Magic City Realtors is an independent real estate brokerage servicing the South Florida real estate community