Amazing unit! Great views! 32x32 white porcelain floors thruout. Custom quartz countertops with mitered edges, waterfall side panel on the kitchen island Full height backsplashes. New microwave, AC unit 6 years old. New kitchen fixtures , new hardware. New contemporary AC VENTS. Fully renovated bathroom with quartz vanity top. Shower glass enclosure. New bathroom exhaust. California closets New baseboards. All new door handles New blinds. Freshly painted. Don’t miss this amazing opportunity! You will love this unit! One of the best locations in Miami.
| Address | Unit # | Price | %Chng | Bed/Bath | Square Feet | Square m2 | Maint/$ |
|---|---|---|---|---|---|---|---|
| 111 E Flagler St #810 | 810 | $229,000 | 1/1 | 774 | 72 | $850 | |
| 111 E Flagler St #606 | 606 | $230,000 | 1/1 | 553 | 51 | $644 | |
| 111 E Flagler St #507 | 507 | $232,000 | 1/1 | 623 | 58 | $686 | |
| 111 E Flagler St #506 | 506 | $235,000 | 1/1 | 553 | 51 | $648 | |
| 111 E Flagler St #1003 | 1003 | $255,000 | 1/1 | 594 | 55 | $655 | |
| 253 NE 2nd St #219 | 219 | $260,000 | 1/1 | 506 | 47 | $620 | |
| 111 E Flagler St #410 | 410 | $262,000 | 1/1 | 774 | 72 | $0 | |
| 111 E Flagler St #708 | 708 | $275,000 | 1/1 | 615 | 57 | $723 | |
| 234 NE 3rd St #UPH09 | UPH09 | $282,000 | 1/1 | 625 | 58 | $738 | |
| 234 NE 3rd St #1106 | 1106 | $289,000 | 1/1 | 738 | 69 | $874 | |
| 111 E Flagler St #705 | 705 | $299,000 | 2/1 | 836 | 78 | $975 | |
| 133 NE 2nd Ave #209 | 209 | $307,000 | 1/1 | 770 | 72 | $765 | |
| 111 E Flagler St #805 | 805 | $309,000 | 2/1 | 836 | 78 | $973 | |
| 133 NE 2nd Ave #1103 | 1103 | $310,000 | 1/1 | 632 | 59 | $532 | |
| 234 NE 3rd St #905 | 905 | $319,000 | 1/1 | 685 | 64 | $640 |
| Unit # | Closed Date | Sold Price | List Price | Bed | Bath | Living Area | Days on Market |
|---|---|---|---|---|---|---|---|
| 324 | 05/22/2026 | $222,500 | $249,500 | 0 | 1 | 506 | 5 months |
| 4616 | 04/15/2026 | $415,000 | $439,900 | 0 | 1 | 362 | 4 months |
| 348 | 04/02/2026 | $250,000 | $250,000 | 0 | 1 | 501 | 4 months |
| 318 | 02/20/2026 | $230,000 | $250,000 | 0 | 1 | 506 | 2 months |
| 1906 | 01/28/2026 | $475,000 | $489,900 | 0 | 1 | 443 | 3 months |
| Number of Units | Avg Price | Avg $/SQFT | Lowest Sale Price | Highest Sale Price | Avg Days on Market |
|---|---|---|---|---|---|
| 5 | $318,500 | $761 | $222,500 | $475,000 | 126 |
| Unit # | Closed Date | Sold Price | List Price | Bed | Bath | Living Area | Days on Market |
|---|---|---|---|---|---|---|---|
| 1905 | 04/20/2026 | $420,000 | $450,000 | 1 | 1 | 442 | 3 months |
| 4309 | 03/30/2026 | $470,000 | $495,000 | 1 | 1 | 588 | 1 month |
| 1208 | 03/09/2026 | $345,000 | $355,000 | 1 | 1 | 740 | 2 months |
| 803 | 02/13/2026 | $227,000 | $228,000 | 1 | 1 | 594 | 2 months |
| 229 | 02/11/2026 | $415,000 | $450,000 | 1 | 1 | 1,000 | 2 months |
| 3807 | 02/02/2026 | $390,000 | $399,000 | 1 | 1 | 768 | 1 week |
| L-414 | 01/30/2026 | $570,000 | $580,000 | 1 | 1 | 891 | 2 months |
| Number of Units | Avg Price | Avg $/SQFT | Lowest Sale Price | Highest Sale Price | Avg Days on Market |
|---|---|---|---|---|---|
| 7 | $405,286 | $621 | $227,000 | $570,000 | 69 |
| Unit # | Closed Date | Sold Price | List Price | Bed | Bath | Living Area | Days on Market |
|---|---|---|---|---|---|---|---|
| 1602 | 05/27/2026 | $526,100 | $580,000 | 2 | 2 | 1,129 | 3 months |
| 1803 | 04/29/2026 | $535,000 | $590,000 | 2 | 2 | 1,058 | 5 months |
| 3709 | 04/27/2026 | $1,150,000 | $1,200,000 | 2 | 2 | 983 | 4 months |
| 4704 | 03/10/2026 | $650,000 | $680,000 | 2 | 2 | 1,121 | 2 months |
| 312 | 03/04/2026 | $385,000 | $440,000 | 2 | 2 | 1,120 | 7 months |
| 1808 | 02/19/2026 | $405,000 | $450,000 | 2 | 2 | 1,006 | 6 months |
| 3503 | 01/30/2026 | $690,000 | $715,000 | 2 | 2 | 1,235 | 2 months |
| Number of Units | Avg Price | Avg $/SQFT | Lowest Sale Price | Highest Sale Price | Avg Days on Market |
|---|---|---|---|---|---|
| 7 | $620,157 | $617 | $385,000 | $1,150,000 | 140 |
| Unit # | Closed Date | Sold Price | List Price | Bed | Bath | Living Area | Days on Market |
|---|---|---|---|---|---|---|---|
| 3102 | 02/27/2026 | $1,030,000 | $1,099,000 | 3 | 2 | 1,789 | 3 weeks |
| Number of Units | Avg Price | Avg $/SQFT | Lowest Sale Price | Highest Sale Price | Avg Days on Market |
|---|---|---|---|---|---|
| 1 | $1,030,000 | $614 | $1,030,000 | $1,030,000 | 23 |
www.fiftybiscayne.com is not responsible for the accuracy of the information listed above. The data relating to real estate for sale on this web site comes in part from the Internet Data Exchange Program and the South East Florida Regional MLS and is provided here for consumers personal, non-commercial use, It may not be used for any purpose other than to identify prospective properties consumers may be interested in purchasing. Real Estate listings held by brokerage firms other than the office owning this web site are marked with the IDX logo. Data provided is deemed reliable but not guaranteed. Listing provided by Cervera Real Estate Inc.
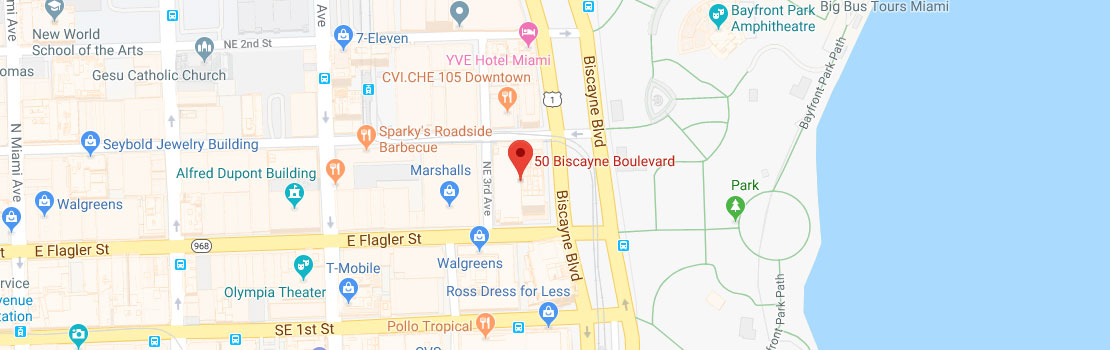
© Copyright 2012-2016. Brenda Bassett | Broker-Associate | 50 Biscayne Blvd | Downtown Miami, FL 33131 | Cell: 305-707-4007
Magic City Realtors is an independent real estate brokerage servicing the South Florida real estate community