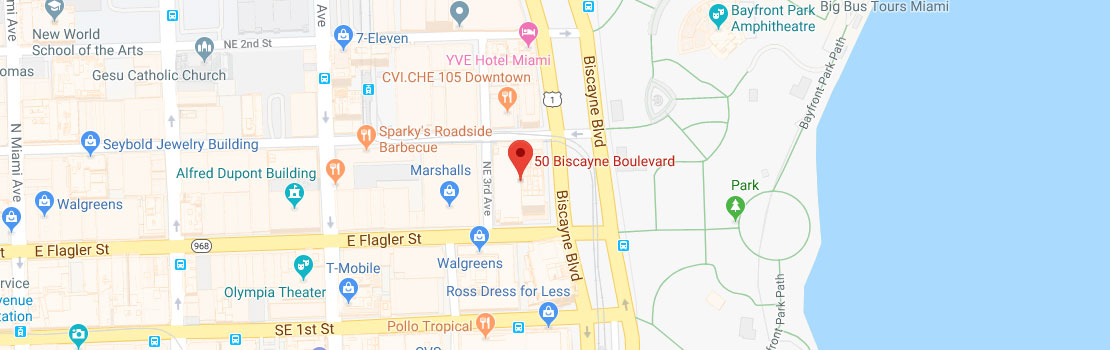
A truly one-of-one residence in the heart of Downtown Miami. Rarely available, this spectacular developer-combined residence is the only 4-bedroom, 4-bathroom home currently available at 50 Biscayne, created by merging a 3-bedroom and 2-bedroom residence into an expansive 3,059 SF sky home occupying the entire south corner of the 25th floor. Surrounded by wraparound terraces that embrace the entire residence, enjoy breathtaking 280-degree panoramic views stretching from sunrise over Biscayne Bay to the city skyline and unforgettable sunsets. The thoughtfully designed floor plan offers exceptional scale and flexibility with two spacious living areas, generous storage, and seamless indoor-outdoor living. **Two assigned garage parking spaces conveniently located on the third floor. Located in Miami’s most walkable urban neighborhood, 50 Biscayne places you steps from Bayfront Park, the Kaseya Center, museums, theaters, Bayside Marketplace, Whole Foods, world-class dining, entertainment, and just minutes from Brickell. A rare opportunity to own one of the most unique residences ever created at 50 Biscayne. It's time to see it yourself! Call today to inquire for a private tour.
| Address | Unit # | Price | %Chng | Bed/Bath | Square Feet | Square m2 | Maint/$ |
|---|---|---|---|---|---|---|---|
| 111 E Flagler St #810 | 810 | $229,000 | 1/1 | 774 | 72 | $850 | |
| 111 E Flagler St #606 | 606 | $230,000 | 1/1 | 553 | 51 | $644 | |
| 111 E Flagler St #507 | 507 | $232,000 | 1/1 | 623 | 58 | $686 | |
| 111 E Flagler St #506 | 506 | $235,000 | 1/1 | 553 | 51 | $648 | |
| 111 E Flagler #702 | 702 | $250,000 | 1/1 | 603 | 56 | $708 | |
| 111 E Flagler St #1003 | 1003 | $255,000 | 1/1 | 594 | 55 | $655 | |
| 253 NE 2nd St #219 | 219 | $260,000 | 1/1 | 506 | 47 | $620 | |
| 253 NE 2nd St #220 | 220 | $267,000 | 0/1 | 560 | 52 | $702 | |
| 133 NE 2nd Ave #909 | 909 | $270,000 | 1/1 | 662 | 61 | $619 | |
| 111 E Flagler St #708 | 708 | $275,000 | 1/1 | 615 | 57 | $723 | |
| 133 NE 2nd Ave #611 | 611 | $285,000 | 1/1 | 651 | 60 | $609 | |
| 234 NE 3rd St #1106 | 1106 | $289,000 | 1/1 | 738 | 69 | $874 | |
| 133 NE 2nd Ave #1209 | 1209 | $299,000 | 1/1 | 662 | 61 | $659 | |
| 111 E Flagler St #705 | 705 | $299,000 | 2/1 | 836 | 78 | $975 | |
| 111 E Flagler St #805 | 805 | $309,000 | 2/1 | 836 | 78 | $973 |
| Unit # | Closed Date | Sold Price | List Price | Bed | Bath | Living Area | Days on Market |
|---|---|---|---|---|---|---|---|
| 324 | 05/22/2026 | $222,500 | $249,500 | 0 | 1 | 506 | 5 months |
| 4616 | 04/15/2026 | $415,000 | $439,900 | 0 | 1 | 362 | 4 months |
| 348 | 04/02/2026 | $250,000 | $250,000 | 0 | 1 | 501 | 4 months |
| 318 | 02/20/2026 | $230,000 | $250,000 | 0 | 1 | 506 | 2 months |
| 1906 | 01/28/2026 | $475,000 | $489,900 | 0 | 1 | 443 | 3 months |
| Number of Units | Avg Price | Avg $/SQFT | Lowest Sale Price | Highest Sale Price | Avg Days on Market |
|---|---|---|---|---|---|
| 5 | $318,500 | $761 | $222,500 | $475,000 | 126 |
| Unit # | Closed Date | Sold Price | List Price | Bed | Bath | Living Area | Days on Market |
|---|---|---|---|---|---|---|---|
| 1905 | 04/20/2026 | $420,000 | $450,000 | 1 | 1 | 442 | 3 months |
| 4309 | 03/30/2026 | $470,000 | $495,000 | 1 | 1 | 588 | 1 month |
| 1208 | 03/09/2026 | $345,000 | $355,000 | 1 | 1 | 740 | 2 months |
| 803 | 02/13/2026 | $227,000 | $228,000 | 1 | 1 | 594 | 2 months |
| 229 | 02/11/2026 | $415,000 | $450,000 | 1 | 1 | 1,000 | 2 months |
| 3807 | 02/02/2026 | $390,000 | $399,000 | 1 | 1 | 768 | 1 week |
| L-414 | 01/30/2026 | $570,000 | $580,000 | 1 | 1 | 891 | 2 months |
| Number of Units | Avg Price | Avg $/SQFT | Lowest Sale Price | Highest Sale Price | Avg Days on Market |
|---|---|---|---|---|---|
| 7 | $405,286 | $621 | $227,000 | $570,000 | 69 |
| Unit # | Closed Date | Sold Price | List Price | Bed | Bath | Living Area | Days on Market |
|---|---|---|---|---|---|---|---|
| 1602 | 05/27/2026 | $526,100 | $580,000 | 2 | 2 | 1,129 | 3 months |
| 1803 | 04/29/2026 | $535,000 | $590,000 | 2 | 2 | 1,058 | 5 months |
| 3709 | 04/27/2026 | $1,150,000 | $1,200,000 | 2 | 2 | 983 | 4 months |
| 4704 | 03/10/2026 | $650,000 | $680,000 | 2 | 2 | 1,121 | 2 months |
| 312 | 03/04/2026 | $385,000 | $440,000 | 2 | 2 | 1,120 | 7 months |
| 1808 | 02/19/2026 | $405,000 | $450,000 | 2 | 2 | 1,006 | 6 months |
| 3503 | 01/30/2026 | $690,000 | $715,000 | 2 | 2 | 1,235 | 2 months |
| Number of Units | Avg Price | Avg $/SQFT | Lowest Sale Price | Highest Sale Price | Avg Days on Market |
|---|---|---|---|---|---|
| 7 | $620,157 | $617 | $385,000 | $1,150,000 | 140 |
| Unit # | Closed Date | Sold Price | List Price | Bed | Bath | Living Area | Days on Market |
|---|---|---|---|---|---|---|---|
| 3102 | 02/27/2026 | $1,030,000 | $1,099,000 | 3 | 2 | 1,789 | 3 weeks |
| Number of Units | Avg Price | Avg $/SQFT | Lowest Sale Price | Highest Sale Price | Avg Days on Market |
|---|---|---|---|---|---|
| 1 | $1,030,000 | $614 | $1,030,000 | $1,030,000 | 23 |
www.fiftybiscayne.com is not responsible for the accuracy of the information listed above. The data relating to real estate for sale on this web site comes in part from the Internet Data Exchange Program and the South East Florida Regional MLS and is provided here for consumers personal, non-commercial use, It may not be used for any purpose other than to identify prospective properties consumers may be interested in purchasing. Real Estate listings held by brokerage firms other than the office owning this web site are marked with the IDX logo. Data provided is deemed reliable but not guaranteed. Listing provided by Compass Florida, LLC
© Copyright 2012-2016. Brenda Bassett | Broker-Associate | 50 Biscayne Blvd | Downtown Miami, FL 33131 | Cell: 305-707-4007
Magic City Realtors is an independent real estate brokerage servicing the South Florida real estate community