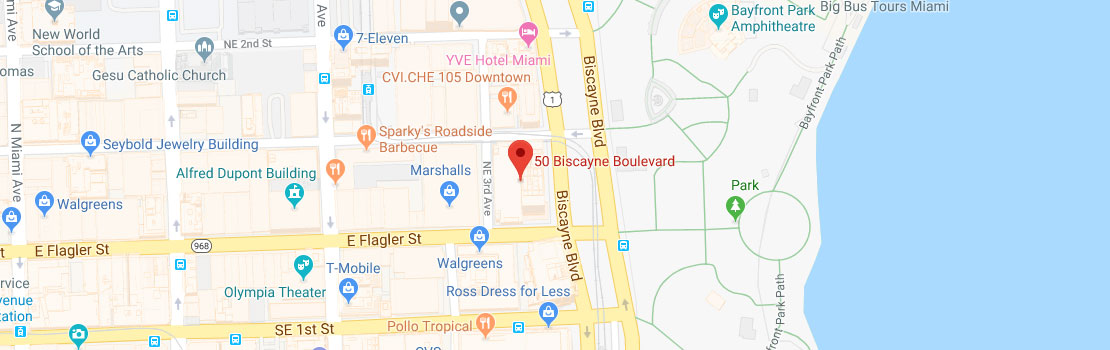
MOTIVATED SELLER – PRICED TO SELL! Excellent opportunity to own a spacious 567 SF studio at 50 Biscayne, ideally located in the heart of Downtown Miami. Unit 1409 features an open, functional layout and a private balcony with beautiful views overlooking Bayside and the water, the perfect setting to enjoy Miami’s vibrant city and waterfront lifestyle. Just steps from Bayfront Park, Bayside Marketplace, dining, shopping, entertainment, and public transportation, with Brickell, Miami Beach, and major highways only minutes away. Ideal as a primary residence, pied-à-terre, or investment opportunity. Well positioned in the market and ready for its next owner. Seller is motivated, bring your offers!
| Address | Unit # | Price | %Chng | Bed/Bath | Square Feet | Square m2 | Maint/$ |
|---|---|---|---|---|---|---|---|
| 111 E Flagler St #406 | 406 | $215,000 | 1/1 | 553 | 51 | $648 | |
| 111 E Flagler St #810 | 810 | $219,000 | 1/1 | 774 | 72 | $850 | |
| 111 E Flagler St #606 | 606 | $230,000 | 1/1 | 553 | 51 | $644 | |
| 111 E Flagler St #506 | 506 | $235,000 | 1/1 | 553 | 51 | $648 | |
| 253 NE 2nd St #234 | 234 | $240,000 | 0/1 | 506 | 47 | $635 | |
| 111 E Flagler St #902 | 902 | $254,100 | 1/1 | 603 | 56 | $703 | |
| 111 E Flagler St #1003 | 1003 | $255,000 | 1/1 | 594 | 55 | $655 | |
| 234 NE 3rd St #1106 | 1106 | $269,000 | 1/1 | 738 | 69 | $874 | |
| 111 E Flagler St #705 | 705 | $275,000 | 2/1 | 836 | 78 | $975 | |
| 133 NE 2nd Ave #2111 | 2111 | $295,000 | 1/1 | 651 | 60 | $646 | |
| 234 NE 3rd St #905 | 905 | $295,000 | 1/1 | 685 | 64 | $640 | |
| 0 #1104 | 1104 | $298,000 | 1/1 | 644 | 60 | $639 | |
| 133 NE 2nd Ave #209 | 209 | $299,000 | 1/1 | 770 | 72 | $765 | |
| 111 E Flagler St #805 | 805 | $305,000 | 2/1 | 836 | 78 | $973 | |
| 234 NE 3rd St #1204 | 1204 | $309,999 | 1/1 | 784 | 73 | $895 |
| Unit # | Closed Date | Sold Price | List Price | Bed | Bath | Living Area | Days on Market |
|---|---|---|---|---|---|---|---|
| 324 | 05/22/2026 | $222,500 | $249,500 | 0 | 1 | 506 | 5 months |
| 4616 | 04/15/2026 | $415,000 | $439,900 | 0 | 1 | 362 | 4 months |
| 348 | 04/02/2026 | $250,000 | $250,000 | 0 | 1 | 501 | 4 months |
| 318 | 02/20/2026 | $230,000 | $250,000 | 0 | 1 | 506 | 2 months |
| 1906 | 01/28/2026 | $475,000 | $489,900 | 0 | 1 | 443 | 3 months |
| Number of Units | Avg Price | Avg $/SQFT | Lowest Sale Price | Highest Sale Price | Avg Days on Market |
|---|---|---|---|---|---|
| 5 | $318,500 | $761 | $222,500 | $475,000 | 126 |
| Unit # | Closed Date | Sold Price | List Price | Bed | Bath | Living Area | Days on Market |
|---|---|---|---|---|---|---|---|
| 1905 | 04/20/2026 | $420,000 | $450,000 | 1 | 1 | 442 | 3 months |
| 4309 | 03/30/2026 | $470,000 | $495,000 | 1 | 1 | 588 | 1 month |
| 1208 | 03/09/2026 | $345,000 | $355,000 | 1 | 1 | 740 | 2 months |
| 803 | 02/13/2026 | $227,000 | $228,000 | 1 | 1 | 594 | 2 months |
| 229 | 02/11/2026 | $415,000 | $450,000 | 1 | 1 | 1,000 | 2 months |
| 3807 | 02/02/2026 | $390,000 | $399,000 | 1 | 1 | 768 | 1 week |
| L-414 | 01/30/2026 | $570,000 | $580,000 | 1 | 1 | 891 | 2 months |
| Number of Units | Avg Price | Avg $/SQFT | Lowest Sale Price | Highest Sale Price | Avg Days on Market |
|---|---|---|---|---|---|
| 7 | $405,286 | $621 | $227,000 | $570,000 | 69 |
| Unit # | Closed Date | Sold Price | List Price | Bed | Bath | Living Area | Days on Market |
|---|---|---|---|---|---|---|---|
| 1602 | 05/27/2026 | $526,100 | $580,000 | 2 | 2 | 1,129 | 3 months |
| 1803 | 04/29/2026 | $535,000 | $590,000 | 2 | 2 | 1,058 | 5 months |
| 3709 | 04/27/2026 | $1,150,000 | $1,200,000 | 2 | 2 | 983 | 4 months |
| 4704 | 03/10/2026 | $650,000 | $680,000 | 2 | 2 | 1,121 | 2 months |
| 312 | 03/04/2026 | $385,000 | $440,000 | 2 | 2 | 1,120 | 7 months |
| 1808 | 02/19/2026 | $405,000 | $450,000 | 2 | 2 | 1,006 | 6 months |
| 3503 | 01/30/2026 | $690,000 | $715,000 | 2 | 2 | 1,235 | 2 months |
| Number of Units | Avg Price | Avg $/SQFT | Lowest Sale Price | Highest Sale Price | Avg Days on Market |
|---|---|---|---|---|---|
| 7 | $620,157 | $617 | $385,000 | $1,150,000 | 140 |
| Unit # | Closed Date | Sold Price | List Price | Bed | Bath | Living Area | Days on Market |
|---|---|---|---|---|---|---|---|
| 3102 | 02/27/2026 | $1,030,000 | $1,099,000 | 3 | 2 | 1,789 | 3 weeks |
| Number of Units | Avg Price | Avg $/SQFT | Lowest Sale Price | Highest Sale Price | Avg Days on Market |
|---|---|---|---|---|---|
| 1 | $1,030,000 | $614 | $1,030,000 | $1,030,000 | 23 |
www.fiftybiscayne.com is not responsible for the accuracy of the information listed above. The data relating to real estate for sale on this web site comes in part from the Internet Data Exchange Program and the South East Florida Regional MLS and is provided here for consumers personal, non-commercial use, It may not be used for any purpose other than to identify prospective properties consumers may be interested in purchasing. Real Estate listings held by brokerage firms other than the office owning this web site are marked with the IDX logo. Data provided is deemed reliable but not guaranteed. Listing provided by Fortune Christie's International Real Estate
© Copyright 2012-2016. Brenda Bassett | Broker-Associate | 50 Biscayne Blvd | Downtown Miami, FL 33131 | Cell: 305-707-4007
Magic City Realtors is an independent real estate brokerage servicing the South Florida real estate community